
Statistics and reports – YZY Studio
Your figures live, your decisions informed.
YZY Studio brings your event’s statistics together in real time: sales, top-ups, entries and stock in a single dashboard, followed by a full report three days after the event to help you prepare the next edition.
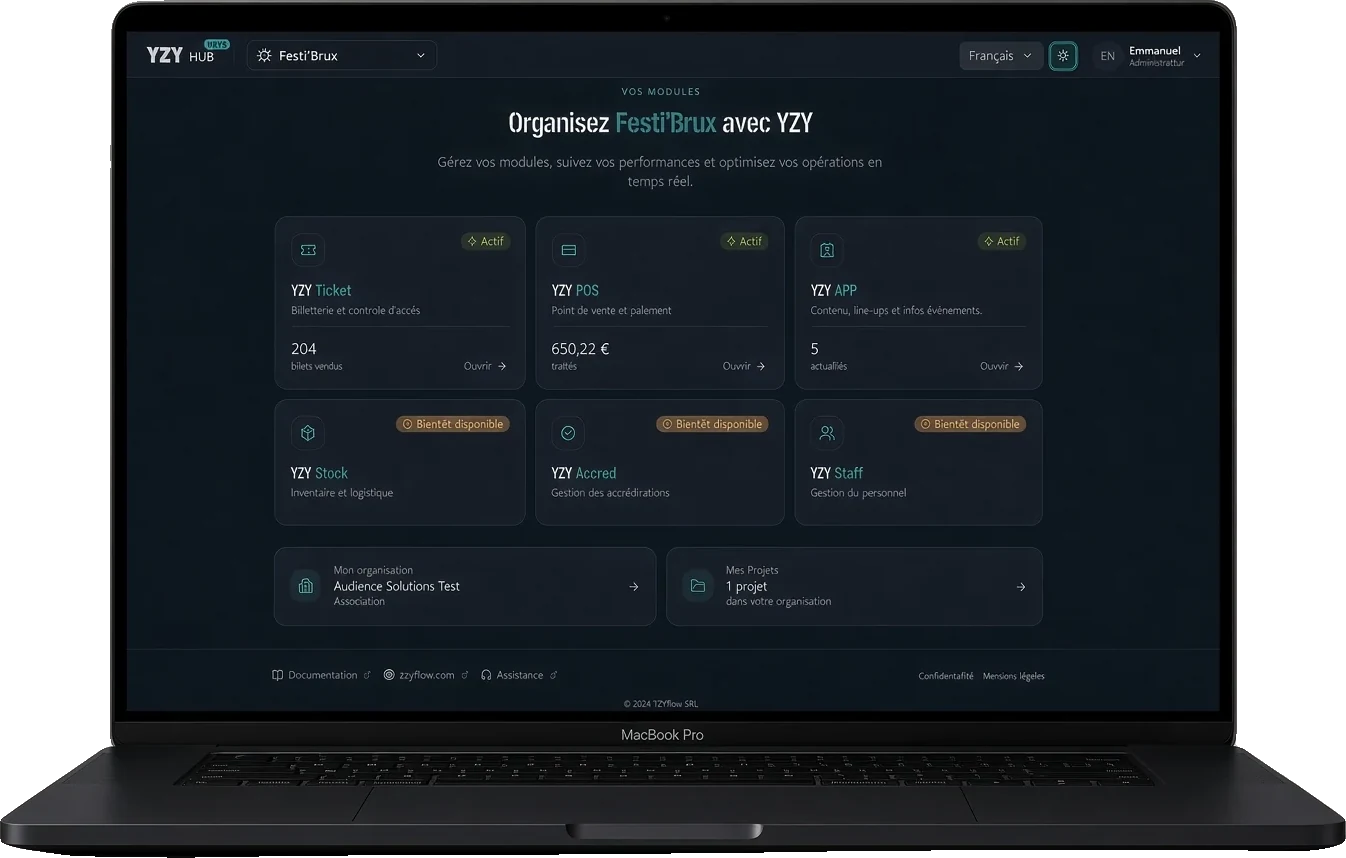
At a glance
Live dashboard
Track sales, top-ups and entries minute by minute, throughout the event.
Report at D+3
Three days after the event, a full report is waiting for you: sales, attendance, products and points of sale.
CSV export
Export your data for your accounting, your partners or your own analysis.
How it works in the field
Data for your sponsors
Attendance and consumption figures: concrete evidence to share with your partners and sponsors.

Prepare the next edition
Which bars were overwhelmed, at what time, with which products: post-event analysis helps you optimise the next edition.

Want to see YZY Studio in action?
An initial 20-minute call to talk about your event, then a demo by video call or on site.
Figures at scale
- Transactions
- 14M+
- Participants
- 943K+
- Events
- 769
What you track, module by module
At the heart of the platform, the Audience interface brings together statistics from every module in real time.
Sales and paymentsWith YZY Pay4
- Live salesBy point of sale, product, server, category or terminal.
- Timestamped historyEvery sale time-stamped to the second, with its status and the reason for each change.
- DepositsCup flows by stand and by hour.
- VATTax reports generated automatically.
Ticketing and attendanceWith YZY Ticket3
- Sales and revenueBy point of sale and by time slot, with remaining tickets.
- Attendance counterAttendees present compared with capacity.
- Show-up rateTickets sold compared with scans.
Season indicatorsVenues, cultural centres and clubs4
- RevenueTicketing on one side, passes on the other, top-ups and fees separately.
- Revenue per seatThe only figure you can compare from one venue to another, date by date.
- Lost revenueUnsold seats multiplied by the reference price.
- Best nightThe season’s most profitable date, in one click.
Entries and zonesWith YZY Access2
- Flow by entranceAttendance at each checkpoint in real time.
- Zone occupancyFull and available zones at a glance.
AppWith YZY Event App3
- AudienceDownloads, active users and adoption rate.
- EngagementNotifications opened, content viewed, favourite artists.
- Top-upsVolume and value of top-ups made in the app.
Exports and APIFor your tools2
- ExportsCSV or XLS for your accounting, your partners or your analysis.
- APIYour data synchronised with your CRM and ERP systems.
Works with
Each module works on its own or with the others: start with what suits you.
Frequently asked questions
When do we receive the post-event report?
Three days after the event, with a detailed analysis of your sales and attendance.
Can we export the data?
Yes, in CSV or XLS, for your management tools or your partners, and an API lets you sync them with your CRM and ERP systems.
Let’s talk about your next event
A demo, a return-on-investment simulation and a quote tailored to your event.